Our new paper on using chemometrics and nanoscale IR to image cellulase distribution inside of T. reesei is out.
When the first lock-down began in Austria at the beginning of March this year (I think. Everything past February is a blur.), I thought this would gave me a lot of time to write blog posts on various topics. For example, I have been meaning to write a post about Seth Kenkel’s and Rohit Bhargava’s paper and compare their new method with Simone Ruggeri’s approach for single protein detection. I also wanted to post a rant on naming conventions in nanoscale IR - a job not made easier by Seth’s “interesting” choice to rename Alex Dazzi’s initial ring down version of AFM-IR into PTIR. But none of those things happened, because Catarina and Rosa had collected so much data before the lock down, that we could actually get busy working on a paper instead.
The basic idea: supervised machine learning at the nanoscale
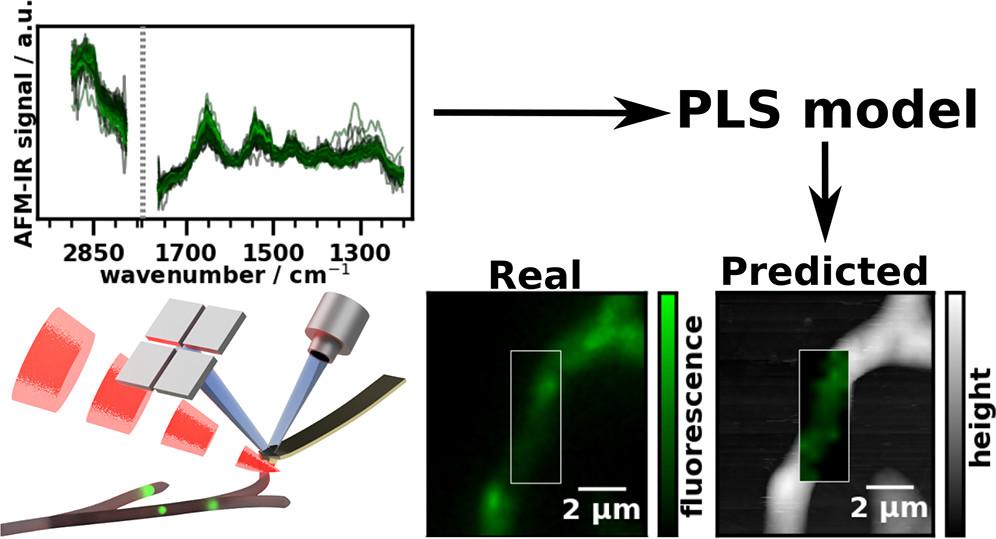
The basic idea of this paper was to demonstrate an approach to supervised machine learning at the nanoscale. There are three challenges here:
it is harder to get ground truth values at this resolution
nanoscale IR tends to be noisier than far field techniques
drift of sample position can be significant at the nanoscale
Ground truth values for supervised machine learning at the nanoscale
While the second and third point basically come down to measure as fast as possible or correct sample drift after the fact, the first point is what I want to focus on here: For point one, we were lucky in having collaboration partners in the biotech department who have been living and breathing Trichoderma reesei for at least a decade (probably not literally).
The challenge in generating ground truth values for hyperspectral imaging in any kind of chemical spectroscopy technique is that the stain or label used to generate these values also modifies the sample chemically in some way. Hence, care has to be taken that the spectral fingerprint of the stain is not the main feature used for modeling. Often, this is solved by either staining after the spectroscopic measurement or by preparing serial sections with very similar properties - one is stained and one is infrared images. However, at the nanoscale, either of those approaches are much trickier than at the micron scale. We can neither prepare similar serial sections of a micro organism nor can we hope that our staining protocol won’t significantly move our sample to make it close to impossible to match the reference image and the nanoscale IR measurement.
Through their decade long experience with T. reesei, Robert L. Mach, Astrid R. Mach-Aigner and Christian Derntl were able to point to a third option: their genetically modified organism expresses yellow fluorescent protein (EYFP) whenever and wherever it produces cellulases (our target analyte). However, the EYFP is known to take the same path out of the cell as cellulases (first through lipid vesicles and then excretion through the membrane) and their fungus is known to produce a much smaller amount of EYFP than cellulases. Thus, we are able to minimize the risk of fitting the presence of EYFP instead of cellulases.
This, of course, won’t be an option every time, thus we are currently working on protocols to stain cells after the nanoscale IR measurement then reference them to AFM images. While this is a chore, the really nice thing is, that after acquiring a calibration once, it can be used for many many samples.
Reproducibility at the nanoscale
Next to being my first paper as corresponding author, this paper can also be considered a first in a second way: this is the first time, we paid a lot attention on making sure that our data processing could be shared. Not only in the sense that we share the program code and describe what we were trying to achieve, but also in the sense that tried to make sure that our code could be run as easily as possible by others. This means including unstable libraries with a specific github commit to make sure that changes in those library won’t change our code. It also took several additional runs of the code in dedicated Python virtual environments to make sure it really runs with exactly the the libraries in the requirements.txt and nothing else. We also tried to strip down the requirements.txt as far as possible so it wouldn’t include libraries that are “always installed” but are not needed for the code we run. I think, in the end, we did a good job in that. Our main processing script, some smaller helper scripts and the raw data are included with the measurement files. All of them are included in a zip file in the SI.
I believe that this is necessary for any kind of paper dealing with large hyper spectral datasets because the results can otherwise not be reproduced. For our previous works - e.g. those on optical effects for bottom illumination AFM-IR could be distilled down to a few spectra and equations, that anybody who is interested is able to reproduce easily. For this paper, however, there is no straight forward way to reproduce our results without exactly doing every single step and even then, the results would be kinda similar but never exactly the same.
<rant> Let’s assume we had just shared the paper without the raw data and code: By just looking at the plots and the descriptions in our experimental section, it would be hard for us to argue our results are correct in the same way that everybody else would have a really hard time showing that we had made mistakes in data evaluation. And even if you reproduced the experiment step by step and were not able to reach the same accuracy - maybe you did something wrong in preparing the samples? Maybe your overlay between fluorescence and AFM image is wrong? Maybe your system is just a tad more noisier than ours and is thus not able to pick up the small differences?
Thousands of similar reasons come to mind that make publications based on large data more similar to PR pieces than to reproducible scientific publications, if the data sets and the processing steps are not published. </rant>