As TU Wien has completely switched to distance learning for the foreseeable future, we had two options for our ongoing lab course in instrumental analytical chemistry:
postpone it until the end of the semester or convert it to distance learning courses. While postponing the course might seem like the obvious, easy choice, it would have meant cramming even more courses into the end of the semester or even considering moving the lab course to the summer break. Therefore, we opted for option two: turn a very applied, hands on lab course into an entirely virtual one, while making sure that it would not be detrimental for the students.
The challenge:
Organizing the FT-IR exercise in the lab, for me, there were three main challenges:
When doing measurements themselves, students were able to experience potential artifacts and operator errors themselves - that was no longer possible when all they had to look at were prerecorded spectra.
The plotting facilities of the proprietary instrument control software were not available to the students.
Neither were the specialized multivariate quantitation routines.
However, I would argue, that each of these challenges is actually an opportunity to make the lab exercise more relevant to the research or job experience we are training our students for. Let me explain.
The solution:
1. Hands on measurements? Who does that?
I expect that most chemistry MScs or PhDs probably wont perform routine analysis in the lab, hence looking at data someone else took and figuring out if it is an artifact is actually more realistic than the hands on work we were teaching in previous years. So, the raw spectra that are handed out to students for interpretation are not all high quality spectra taken by an experienced spectroscopist, but may also be data students took in previous years. Which means some of them were taken with a contaminated background spectrum and show negative CH bands, others were taken with insufficient pressure on the ATR crystal and thus have high signal to noise ratio. I did not go as far as handing out completely mislabeled spectra or spectra taking with a warming MCT detector. That is one step of realism too far.
2. Get our plotting game on.
While using the output from proprietary software for lab note is OK, it just doesn’t fly for academic publications. And as vendors like to plaster their logo on exported images, it would even seem a bit unprofessional for a commercial lab to report using the export from proprietary software.
We decided to leave the choice of program for plotting pretty much open and instead gave guidelines for the formatting - axis labels, x-Axis orientation and so on. I expect most lab reports will contain Excel graphics.
Another side effect was that students - many for the first time - had to contend with an issue that is an eternal annoyance for spectroscopists: how to load data point tables correctly and for people with their computers set to German: how to make sure that the program uses . decimal separator and not ,.
3. Data analysis - Why didn’t we think of this before?
There are two experiments in our lab exercise that involve data analysis beyond what can easily be done with Excel, in one students monitor the progress of an acid-base reaction and in the other they use multivariate calibration to determine the glucose, fructose and sucrose content of soft drinks.
The multivariate calibration is usually done using the OPUS Quant2 routine to establish a PLS model of the data. Of course, that was not available in our distance learning setting. Looking for an alternate solution, there were a few options I considered and ruled out. The first one was MS Excel. While there are plug-ins for Excel that allow to perform PLS, the use of an opaque Excel plug-in seemed a bit sketchy. It also meant, that we would require our students to buy proprietary software for our lab courses or also find PLS plug-ins for LibreOffice. With heavy heart I also had to exclude Python and the excellent scikit-learn package, as programming in any way is currently not part of the chemistry curriculum at TU Wien (I know, right?).
I finally settled on Orange3, a data processing frame work that, was developed with an eye towards use in education.

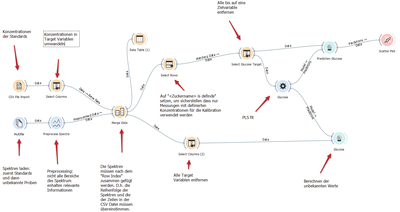
In Orange3, data flow through a schematic containing widgets that perform operations on them. Plotting and data table widgets can be connected at any point in the schematic to peek at the data and when settings are changed, all affected widgets are recalculated.
A toolkit for spectroscopy in Orange3 is available, that plot spectra nicely, integrate bands and even open the data files from the Bruker FT-IR used in the lab. The only missing part was a widget for PLS. However, with a little bit of work, a wrapper around the scikit-learn PLS function enabled this functionality as well. Available on PyPI and Anaconda.
Using this new method to evaluate spectra, students get a much better view into what it is they are actually doing. They can look a their spectra after every preprocessing step and get a direct feedback in how each parameter they set affects the results. Here is a video tutorial on how to do this PLS calibration in Orange:
In the acid-base reaction exercise, a sodium acetate solution is slowly acidified by pumping hydrochloric acid into it. Concurrently, the solution is also pumped through an ATR flow cell. Using the Chromatogramm function of Bruker OPUS, we record a spectrum every 7 seconds and calculate band integrals for sodium acetate, acetic acid and water bands. Students in the lab course so far often had to contend with air bubbles entering the 3D printed flow cell and temporarily changing the overall height of all bands. In a time series of band integrals this appears a transient change of all band heights.
Now that we switched this exercise to Orange3 too, students can use normalization to the O-H stretch band of the spectra to remove the effects of the air bubbles. Furthermore, this also opens the possibility to fine tune integration intervals and baselinOrange logo from Orange, Data Mining Fruitful & Fun, https://orange.biolab.si/e correction to optimize evaluation.
Finally, because Orange3 is free and open source, students can keep using if after the lab exercise.
Orange logo from Orange, Data Mining Fruitful & Fun